Precision-mapped infrastructure
From stranded to revitalized assets.
How likely? How soon? What impact?
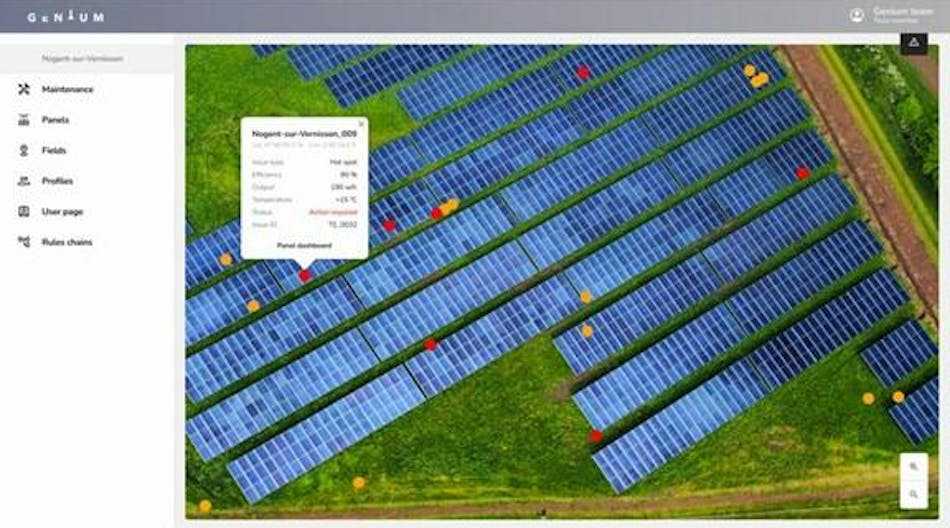
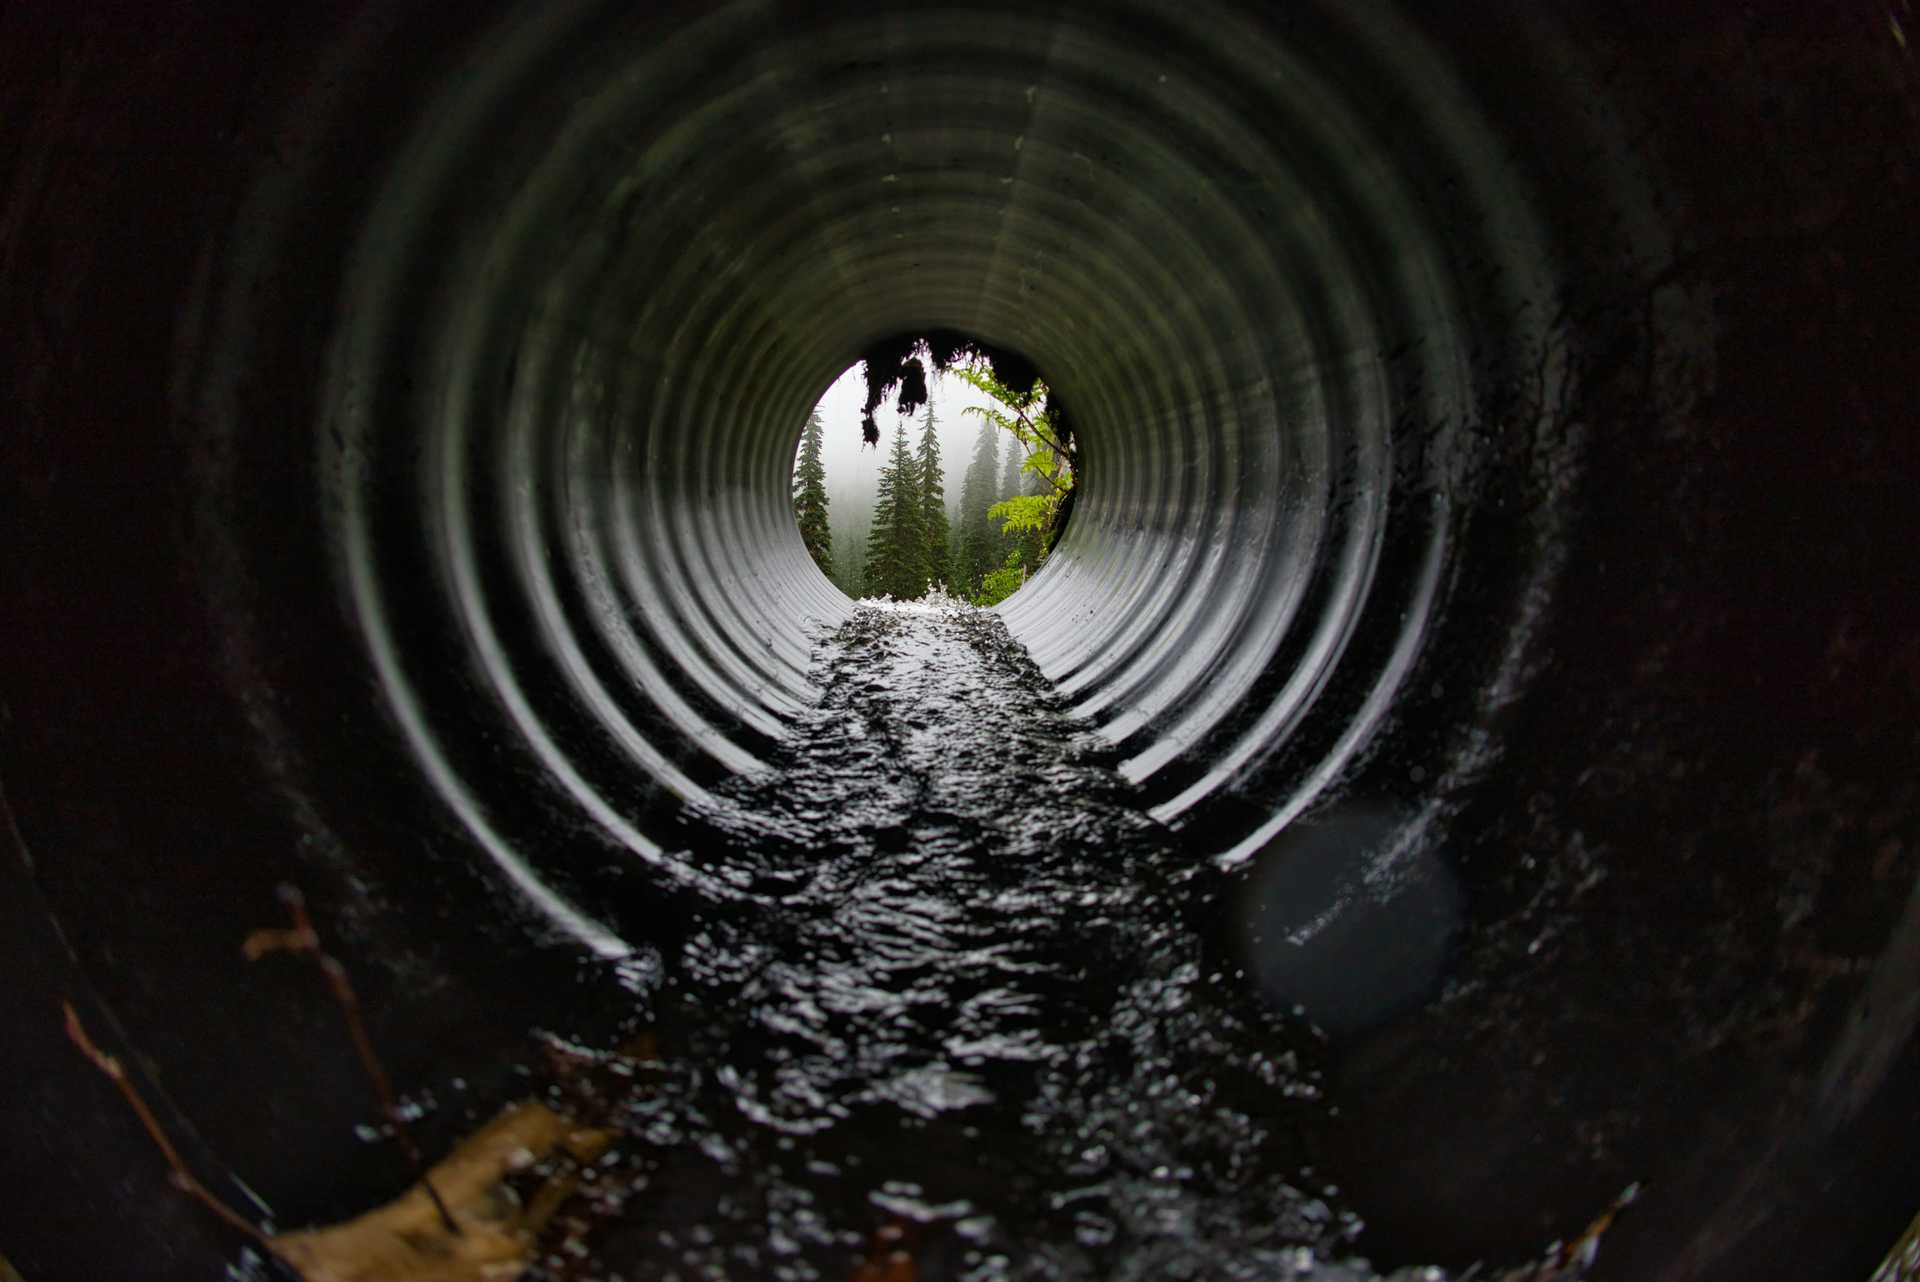
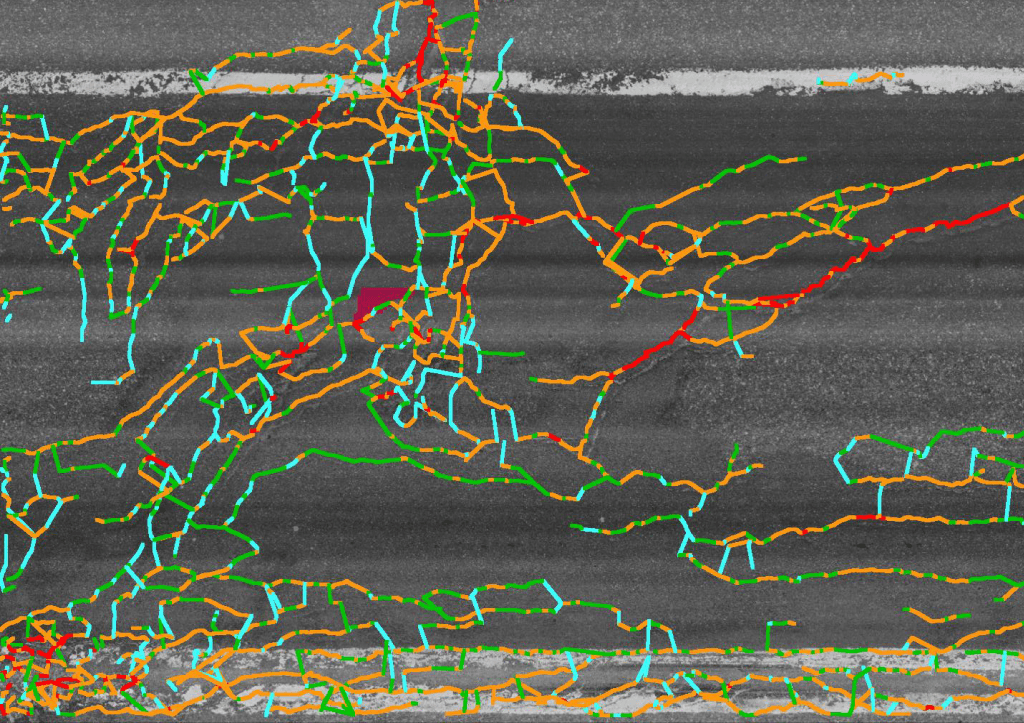
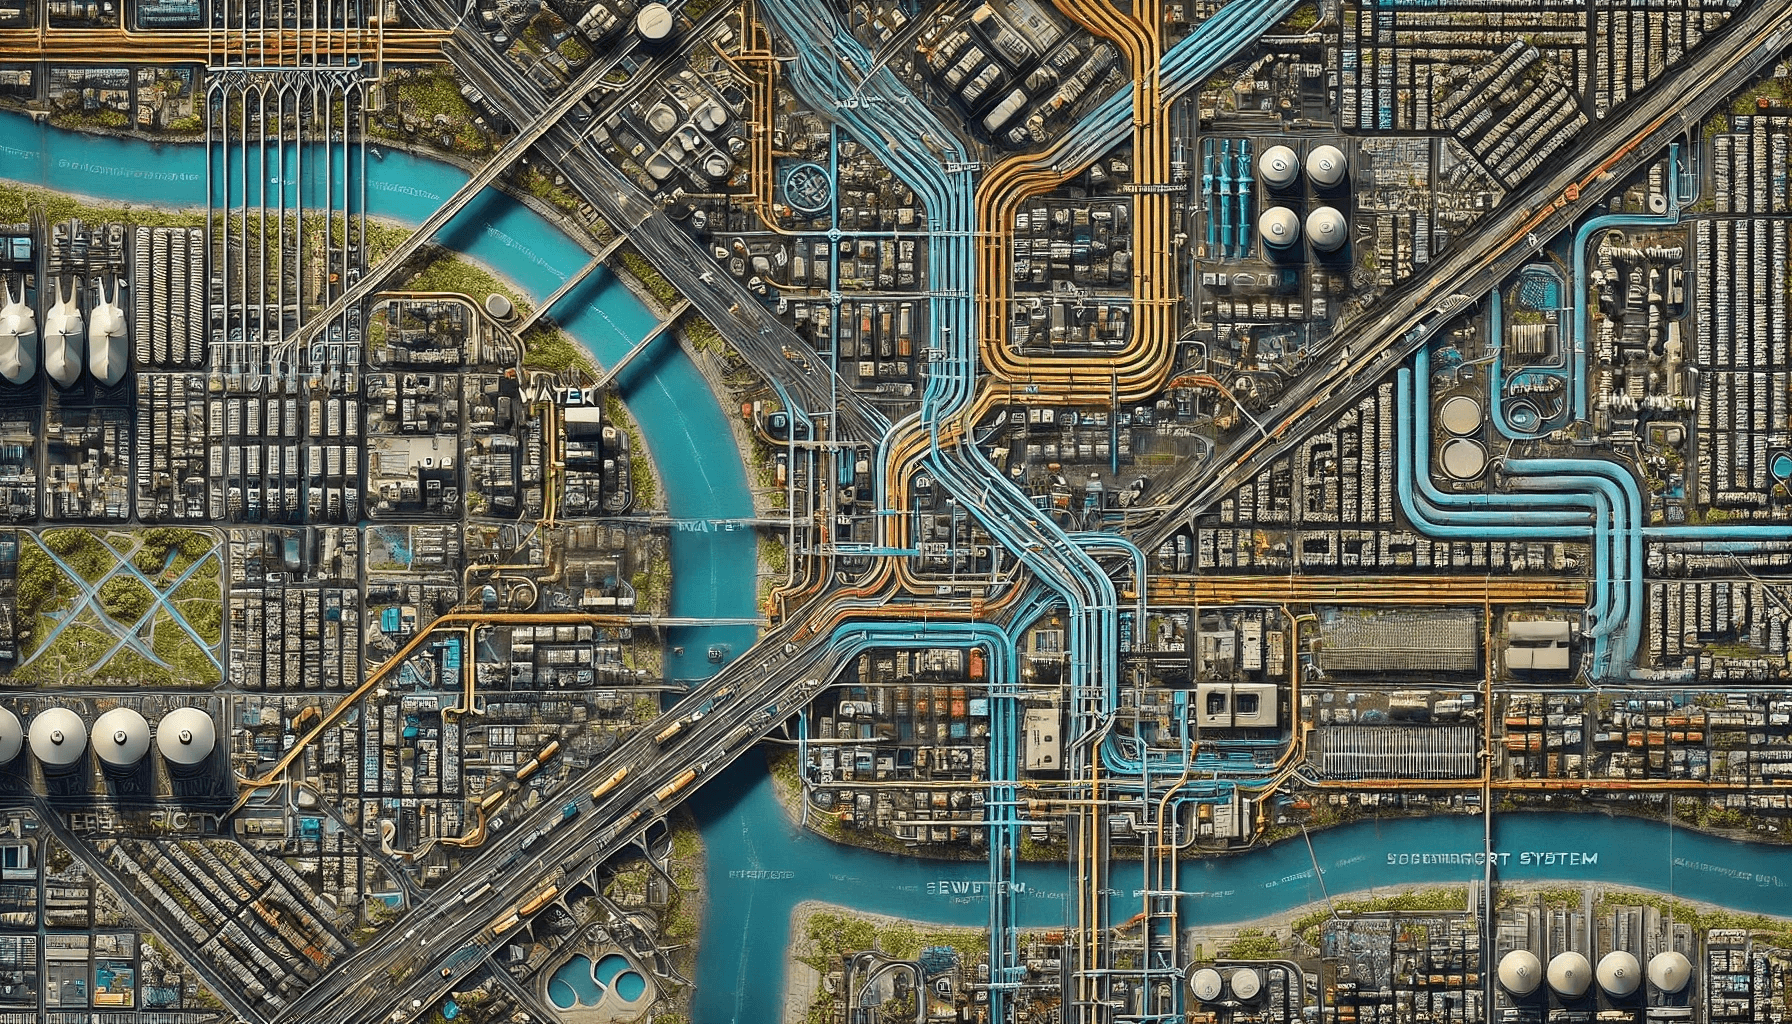
Infrastructure risk puts urban populations at risk. That's why infrastructure owners and operators will increasingly tap new sensing and analytical technologies to create highly detailed, dynamic maps and models of their critical infrastructure. These tools provide will provide unprecedented visibility into the condition and performance of urban infrastructure assets, enabling predictive maintenance by identifying potential issues. This can greatly reduce the risk of critical failures in essential systems for water distribution, electrical grids, sewers, and transportation.
Beyond preventing failure, as precision mapping technologies spread, they will drive a shift - from viewing infrastructure as static, often underutilized assets, to seeing them as resilient, dynamic systems that can be actively monitored, maintained, and optimized. The lifespan of infrastructure can be extended by prioritizing repairs on aging components most likely to fail under climate-induced stresses. Adaptations can also be tailored to specific hazards such as drought, intense rainfall, and extreme temperatures by more efficiently allocating resources and optimizing system performance. And this shift can also enable innovations that unlock new value from existing infrastructure, reducing costs and improving service delivery.
Personalized Insights
How might this trend shape your future? Generate a set of personalized insights to explore challenges, opportunities, and potential innovations. Simply select a sector, occupation, and target year — then press the button and let our AI do the work.
Generator Settings
Signals
Signals are evidence of possible futures found in the world today—technologies, products, services, and behaviors that we expect are already here but could become more widespread tomorrow.
